Infrastructure Delivering for America | Full 2019 Report


This report examines the state of U.S. infrastructure, where we need to go and the economic effects of taking action. Infrastructure undergirds a modern, competitive U.S. economy. The collection of roads and bridges, airports, water systems, dams and levees, ports and urban transit systems facilitates and helps drive innovation, competitiveness, job growth and productivity.

Infrastructure affects us all. For U.S. businesses, every element of economic output depends on the nation’s infrastructure — from the transport of imports, exports and services to our daily commutes. For U.S. households, infrastructure makes America accessible, lowers the costs of everyday goods and activities, helps provide clean water to drink and improves people’s lives. 

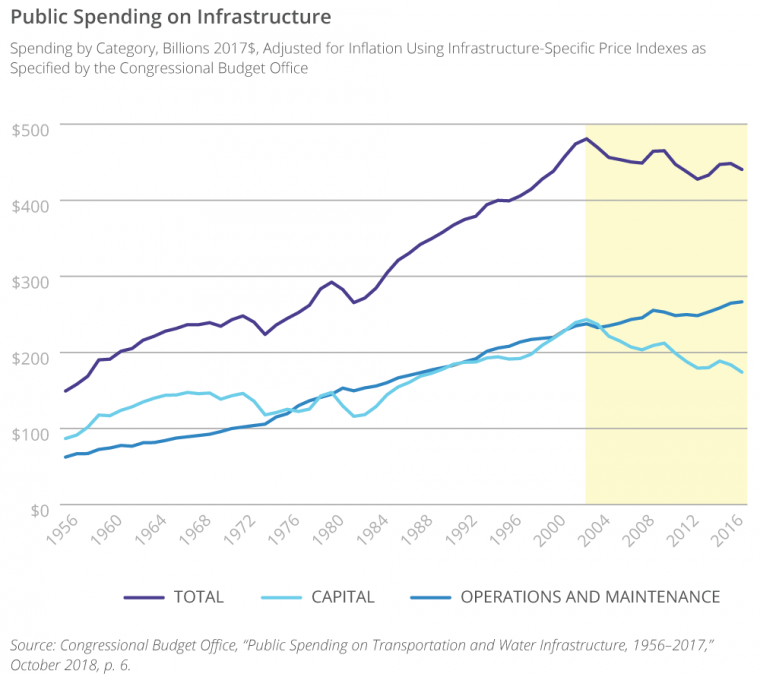
Sadly, America’s infrastructure is falling behind. Public financing has not kept pace with population and economic growth. The growing gap between our needs and our investment threatens not only the quality and reliability of our national infrastructure, but also America’s economic foundation.

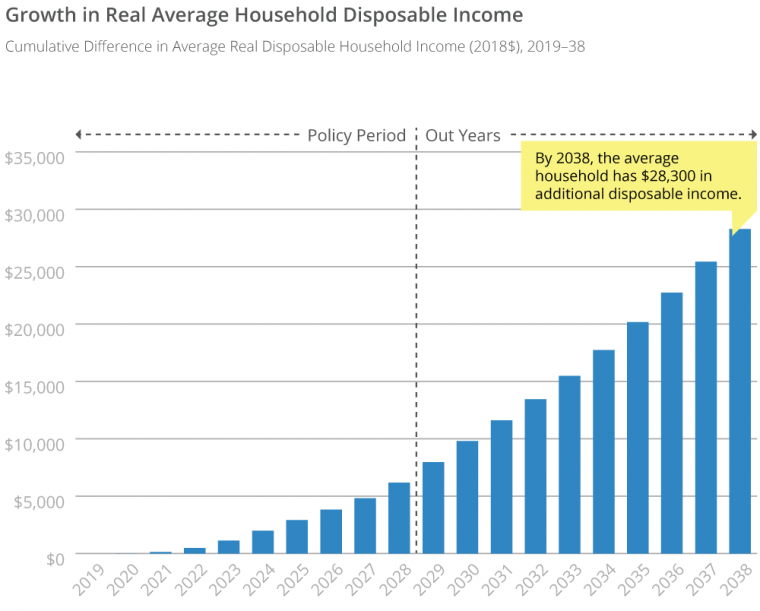
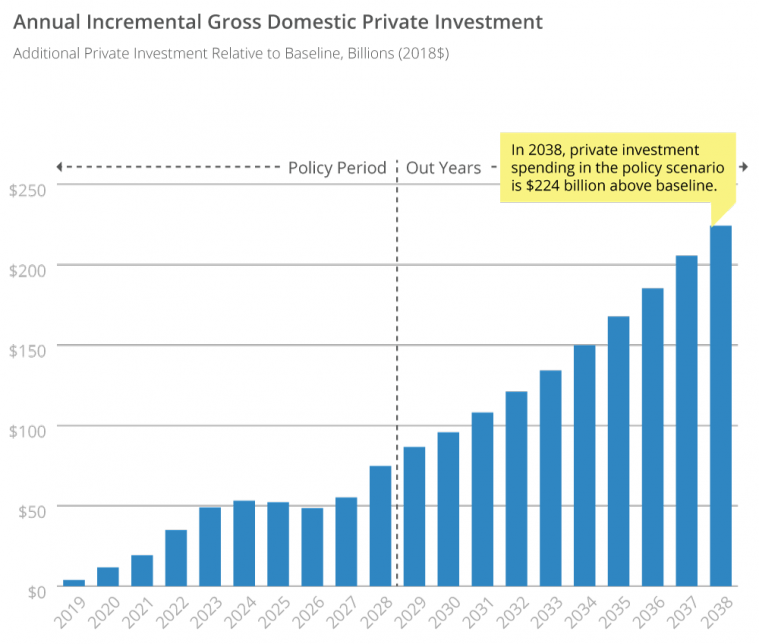
It is time to reinvest in America’s infrastructure. Investing in American infrastructure is a prerequisite for delivering job creation, growth and improved living standards for Americans. It is also a catalyst for the connections and creativity that will power the innovation and economy of the future. Meeting this urgent need requires strong leadership that is focused on restoring America’s gold standard of infrastructure excellence. 

Public spending on infrastructure fell by 8 percent from 2003 to 2017. As a share of gross domestic product (GDP), public infrastructure spending fell by nearly 11 percent over this period, when adjusted for inflation and the cost of infrastructure inputs.

This decline was driven by a sharp drop in capital investment: -28 percent from 2003 to 2014. While spending on capital and on operations and maintenance was roughly equal from the 1970s until 2002, increases in input costs coupled with only marginal increases in nominal spending have created a widening gulf between forward-looking capital investment and maintenance of existing infrastructure.

The United States has also fallen behind its competitors. All but two G7 countries, Italy and Germany, spend a larger share of GDP on infrastructure than the United States.

This decline is profoundly impacting the state of our nation's infrastructure. Both businesses and the typical American family are affected by a decaying system of infrastructure. Already, the lack of investment has taken a toll, and a bold plan is needed to reimagine and rebuild American infrastructure. Investing in infrastructure now can reduce costs and provide benefits at a new scale.

PURPOSE

The purpose of this modeling study is to quantify the significant, long-term economic benefits of rightsizing investment in the nation’s public infrastructure systems. The costs of doing nothing have been well documented. This study endeavors to advance the national conversation by articulating the benefits of doing something.

What the study is not intended to do is advocate a specific spending amount or particular policy mechanisms for increasing investment. What is clear — and what is reflected in the policy scenario — is that it will take hundreds of billions of dollars in additional investment to bring America’s infrastructure systems back into a state of good repair and capacity capable of supporting continued economic growth and international competitiveness. What is also clear is that the federal government must take a leadership role in renewing investment in the nation’s infrastructure systems and that this investment can and must be made in a fiscally responsible manner.

SCOPE

The study is focused narrowly on a core set of infrastructure systems that are primarily publicly funded, particularly those that receive significant federal funding. Investment in privately funded infrastructure systems — freight rail, broadband, energy pipelines, etc. — is robust, and barriers to accelerating investment in these systems are generally related to regulatory and permitting roadblocks, not a lack of funding.

TECHNICAL APPROACH

Business Roundtable partnered with the University of Maryland Inforum modeling group to a conduct a macroeconomic modeling study of the impact of increasing infrastructure investment on the U.S. economy. The model is not an engineering model that estimates the specific community-level impacts of repairing a bridge versus widening a road versus expanding a port. Rather, it is a fully dynamic, general-equilibrium model of the U.S. economy that captures the impacts and feedback loops of increased infrastructure investment across all sectors of the economy. Inputs to the model include (a) a policy scenario that specified spending amount by infrastructure system and funding source and (b) estimates of sector specific productivity effects associated with improved infrastructure. 

Infrastructure investment unlocks meaningful productivity growth and boosts U.S. household income.

  • Investing in infrastructure pays for itself several times over. Every additional $1 invested in infrastructure delivers roughly $3.70 in additional economic growth over 20 years.
  • It adds $5.9 trillion to real GDP over 20 years as a result of a 0.10 percentage point increase in the average annual real GDP growth rate over that period.
  • It increases labor productivity, the benefits of which reach all corners of the economy. Over 20 years, average annual labor productivity is 0.56 percent higher than baseline, and the gap widens with time.
  • It contributes to higher job growth, with 1.1 million additional jobs created by year 10 of the policy scenario (2028).
  • It raises worker wages, adding $1.34 to average real hourly wages by 2038, compared to the baseline scenario.
  • It adds to bank accounts, boosting household real disposable income by an average of $1,400 every year, or $28,300 over 20 years.
  • It catalyzes private investment, adding an additional $1.9 trillion in investment over 20 years.

Macroeconomic Effects: Gross Domestic Product

Faster real GDP growth compounds over time, leading to a substantial increase in long-term potential output. The $5.9 trillion increase in GDP in the policy scenario comprises strong growth in consumption expenditures, meaningful contributions from private investment and government consumption, a boost in U.S. exports, and an offsetting increase in imports. 

  • Additional consumption spending accounts for more than half of GDP gains. Wage gains for workers, higher disposable incomes and a more efficient economy as a result of improved infrastructure stimulate consumption spending throughout the economy. 
  • Gross private domestic investment grows more quickly than consumption spending over the 20-year period. Stronger GDP growth means higher “accelerator” demands for capital spending, which is only partially offset by slightly higher interest rates.
  • Public infrastructure investment boosts government spending, making an additional positive contribution to GDP in the policy scenario. This is driven by substantial increases in public investment in structures.
  • While U.S. exports grow by +$431 billion, contributing positively to economic growth, higher domestic demand for goods and services in the policy scenario and a stronger dollar lead to an offsetting increase in imports over the 20-year period.

Macroeconomic Effects: Productivity

Labor productivity drives long-term economic growth. Over time, this investment keeps delivering continually better and better results.

  • Improved infrastructure reduces economic friction and accelerates productivity by shortening transit times, reducing input costs, lowering inflation and stimulating aggregate demand.
  • It also would add an average of 0.07 percentage point to the annual labor productivity growth rate each year through 2038.
  • The gap between the labor productivity growth rate in the baseline and policy scenarios widens over time, illustrating sustained and growing benefits.
  • Impacts on labor productivity accelerate over time. In year ten of the policy scenario (2028), average labor productivity is 0.4 percent above baseline, compared to 1.3 percent above baseline in 2038.

Macroeconomic Effects: Employment

The stimulative effects of increased investment drive short-term job growth and draw more workers into the labor force.

Most of these impacts are concentrated during the 10-year policy period: By the 10th year of the scenario (i.e., 2028), the economy has 1.1 million more jobs than under the baseline scenario. These gains are maintained over the following decade.

As should be expected, many of these additional jobs are in the construction sector — 301,000 at the end of the 10-year policy period — though other sectors, including retail trade (+125,000) and wholesale trade (+23,000); finance, insurance and real estate (+67,000); and durables manufacturing (+46,000) also enjoy meaningful gains.

The impact of increased infrastructure spending in terms of higher aggregate demand, in the presence of already low unemployment, means that more Americans are pulled into the labor force as wages increase. This effect translates into 846,000 more people in the labor force by 2038 than in the baseline scenario — leading to a modest increase in the labor force participation rate.

Household Effects: Wages

Infrastructure investment adds $1.34 per hour to average real wages by 2038.

  • Infrastructure investment – and the related gains in labor productivity – boosts average annual average real wage growth by 0.13 percentage point over 20 years.
  • By 2038, faster wage growth results in average hourly real wages that are $1.34 per hour higher than in the baseline scenario– an increase of 2.5 percent.
  • Wage growth responds strongly to the short-term effects of increased investment during the policy period.
  • In the out years, the productivity effects of additional investment sustain higher rates of wage growth over the long term.

Household Effects: Disposable Income

Households across the country benefit from infrastructure investment. In fact, infrastructure investment adds $28,300 to average real disposable household income over 20 years.

  • The average U.S. household’s cumulative real disposable income is $28,300 above baseline by the end of the 20-year period. 
  • This increase equates to more than $1,400 per year per household in additional disposable income as a consequence of infrastructure investment.
  • Higher wages — a product of gains in labor productivity — are a key driver of increased household income.

Industry Effects: Private Investment

Infrastructure investment spurs additional private investment in both the short and long terms.

  • Over 20 years, infrastructure investment spurs an additional $1.9 trillion in gross private investment, relative to baseline.
  • Infrastructure investment boosts the average annual growth rate of gross domestic private investment by 0.16 percentage point over baseline during the 20-year period. 
  • Private investment is highly responsive to improved infrastructure and constitutes a larger share of GDP in the policy scenario than under baseline conditions.
  • The vast majority (79 percent) of the increase in private investment spending is due to an increase in business investment spending

Discussion of Key Results

Infrastructure investment has two broad categories of economic benefits: short-term stimulus and long-term productivity gains. While these are distinct policy goals, the findings presented in this study reflect both types of benefits to different degrees.

In the short term, the injection of investment spending creates jobs, pulls additional workers into the labor market, stimulates demand and prompts a temporary acceleration in consumption spending and business investment.

Over the longer term, it is not the additional dollars spent on infrastructure that generate meaningful and sustained economic benefits, but the productivity-enhancing effects of the infrastructure itself. Chief among these benefits is a steady, accelerating increase in labor productivity. Increases in labor productivity are most concentrated in passenger transportation, trucking and warehousing and storage. However, the ripple effects are virtually universal, reaching diverse industries from farming to manufacturing to wholesale and retail trade – driving widespread efficiencies and cost savings.

The impacts of productivity growth are reflected most clearly in the increase in potential U.S. GDP, driven by increased consumption and investment, which accelerates economic growth for the foreseeable future. Households also see tangible benefits from increased productivity – in higher wages, increased disposable income, lower prices and lower spending on key goods and services like transportation. Meanwhile, American industry supports a sustained increase in private investment and output, strengthening their competitive edge and continuing to propel economic growth.

The most compelling rationale for infrastructure investment, which this study quantifies, is long-term economic growth driven by productivity. These gains are broadly distributed, meaningful in scale and build over time – increasing economic efficiency and prosperity nationwide.

Delivering for America State Data

Reinvesting in America's infrastructure system will deliver results across the country. Find out how your state will be impacted by this plan by clicking below.

We use cookies to give you the best experience when using our website. You can click “Accept” if you agree to allow us to place cookies. For more information, please see our Cookie Notice.